Manuals
Exam analysis: learning analytics (P, Rit and Rir values, standard deviation) in student view
In student view, you can access the following analytics: scores, maximum score percentage, percentage of passes and fails, P value, Rit value, Rir value and the question’s standard deviation. The steps that follow explain how to access this information.
-
Tip! For more practical or content-oriented information on the analysis (and constructing) exams, please go to the Online training on assessment.
This module covers the following topics more in-depth:
- Why should I analyse a test?
- Any related terms are explained (P/P’ values, Rir value, Coefficient alpha)
- How to analyse a test?
- Practice with analysing a test.
-
Step 1
- Log in to student view.
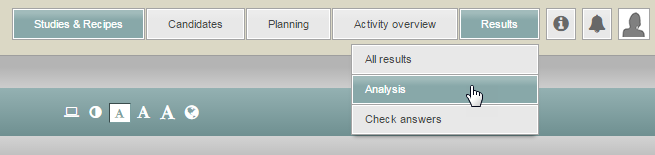
- Click the Results tab, then select Analysis from the drop-down menu.
- Find the exam whose analytics you want to view (you can filter by recipe or test moment using the tabs).
- Or you can use this shortcut to get to the Learning Analytics.
-
Step 2
Tab: Overview
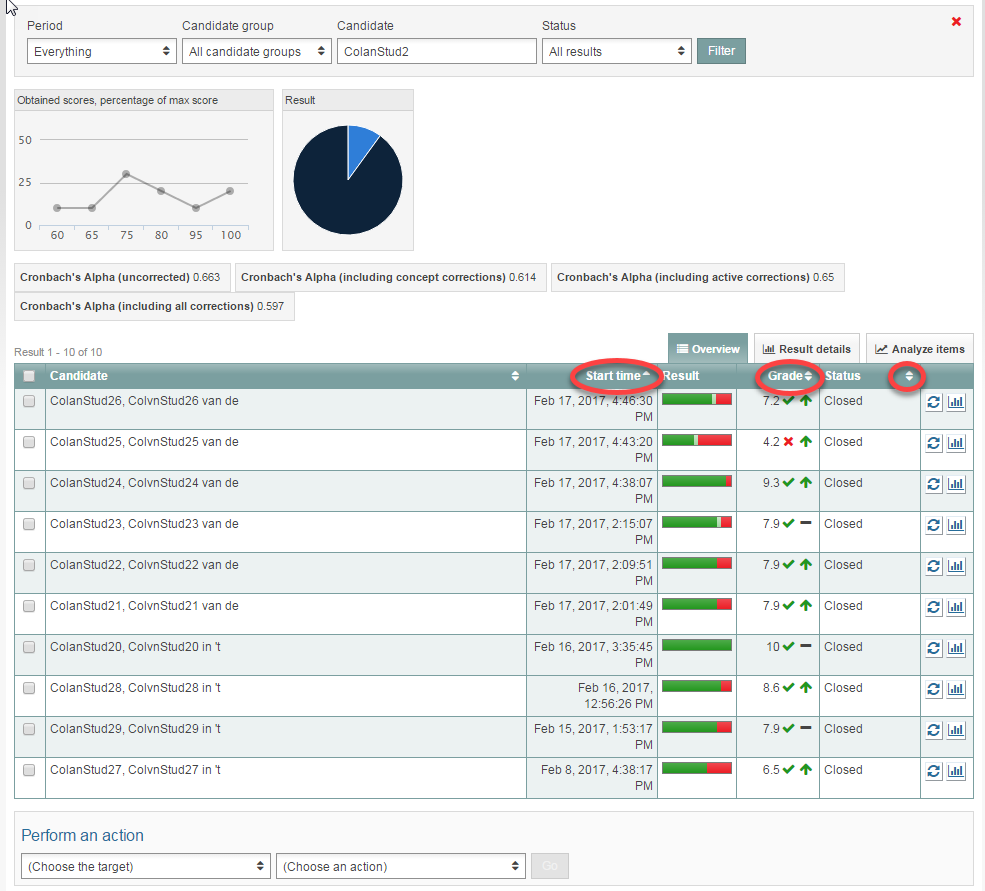
- You will arrive at the following screen in Learning Analytics.
- The line graph shows a percentage of the achieved scores and the pie chart shows the percentages of passing and failing grades when you hover your mouse cursor over it.
- Below the graphs is a list of all students. You can sort students in ascending or descending order of grade, start time or status by clicking the little arrows behind those headers (see image).
- If you have added feedback (i.e. feedback: see scores for specific exam section), a column denoting ‘Feedback + number’ will also be shown in the table. This could either be one or multiple columns, depending on how many pieces of feedback were added.
- The feedback can also be found through its own tab at the top of the table. The various values you find when clicking on that tab are identical to the ones you find when clicking on ‘Result details’ (see next step).
- The Action drop-down menu allows you to export the data to Excel.
-
Step 3
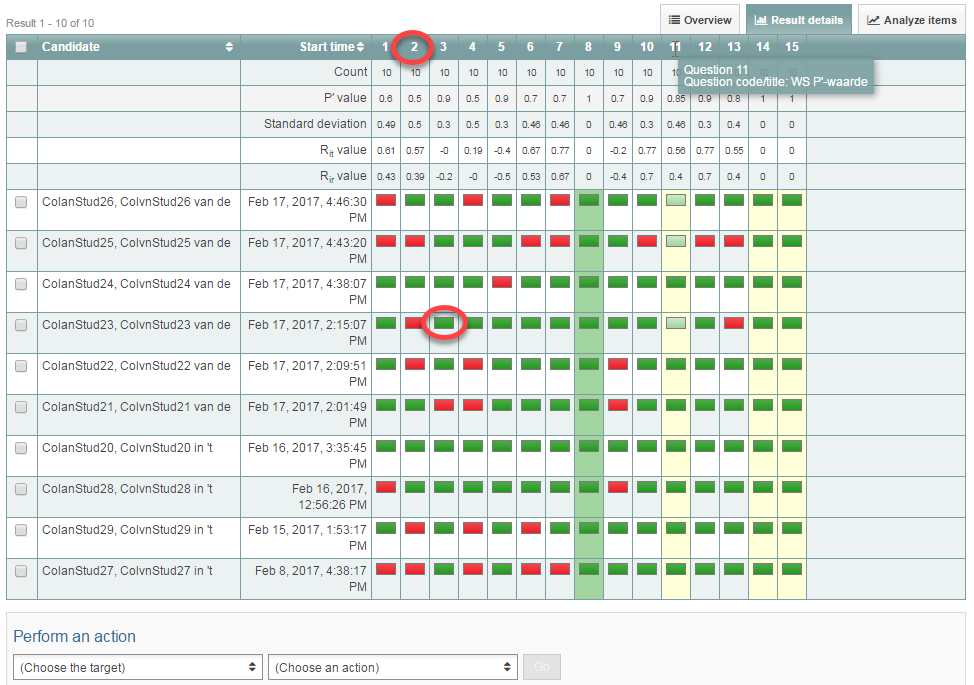
Tab: Result details
- Up and to the right of the list of students is a tab labelled Result details. Click that to see the P value, standard deviation, Rir value and Rit value of each question as well as how the students answered each question.
- To see which question’s information you’re viewing, you need to hover your mouse cursor over one of the numbers (1 to 9, in this example). That will reveal the name of the question. If you want the see the whole question, you have to click the coloured square (red or green). The question will be shown in its entirety, including the student’s answer.
- The Action drop-down menu allows you to export the data to Excel.
-
Step 4
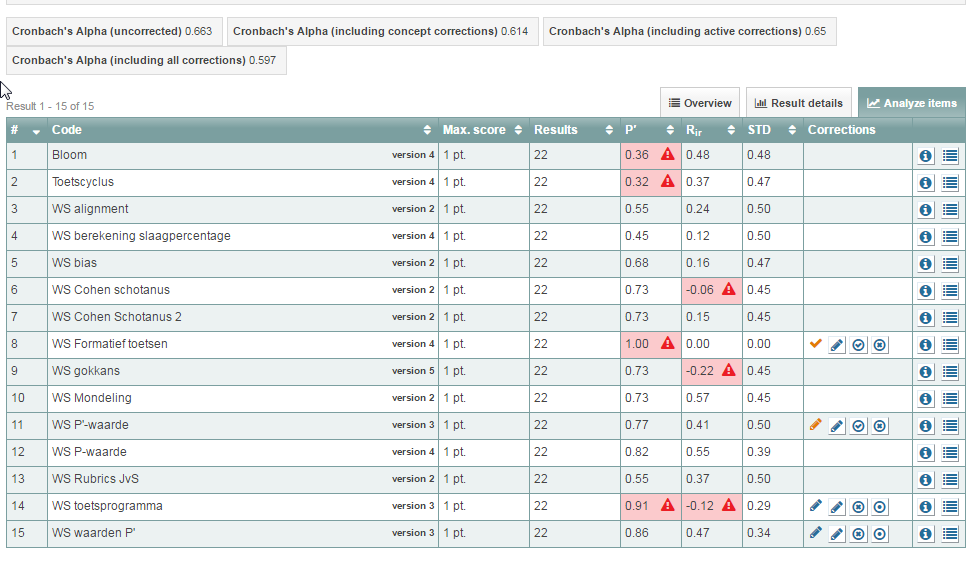
Tab: Analyse questions
- Click on the Analyse questions tab.
- Under ‘Code’, you will see the name of your questions, its ID as noted in the Admin view, and the version used during the exam.
- When you have clicked on the Analyse questions tab, you’ll also see an overview that lists under results the number of students that have answered the question, its P value, its Rit value and its standard deviation.
- Values marked with a red triangle deviate from the defined optimum value. Hover your mouse cursor over these values for an explanation.
- In the column with the word cloud, you can see whether comments have been made on certain questions. Please have a look at this page to learn how to add and read comments.
- On the right-hand side of the table, there are two icons.
- When you click the icon with a lower-case i (show details), you’ll be shown the questions with general information about each question, its version and metadata underneath it.
- When you click the icon that looks like a list (Show answers given), graphs appear showing the number of times students have selected each of the answers. You can modify the answer model directly from this screen if, for instance, it turns out that one of your distractors is actually a valid answer to the question.